Monitor and Insights
Enterprise
Monitor shows how your whole fleet is doing right now: which machines need attention, how fast requests are, what was blocked, and what is serving. Insights looks back over time: cost, local versus online use, reliability, and where a change could save money.
Both are in Fleet, at the top of the sidebar. They need Central Analytics, which comes with Enterprise, and an owner, admin or team manager. A team manager sees only the machines of their teams.
Monitor and Insights count requests, tokens, time and cost. They never store prompts or replies.
Turn on Monitor
Section titled “Turn on Monitor”One machine collects usage reports from the others. It’s called the hub. Pick one that stays on.
- Open Fleet → Monitor.
- Under See your whole fleet in one place, pick the hub under Monitor from.
- Click Turn on Monitor.
- Add the machines you want to monitor.
Give the hub enough disk space for the reports you keep.
Manage reporting
Section titled “Manage reporting”Click Manage at the top of Monitor to see which machines report to the hub.
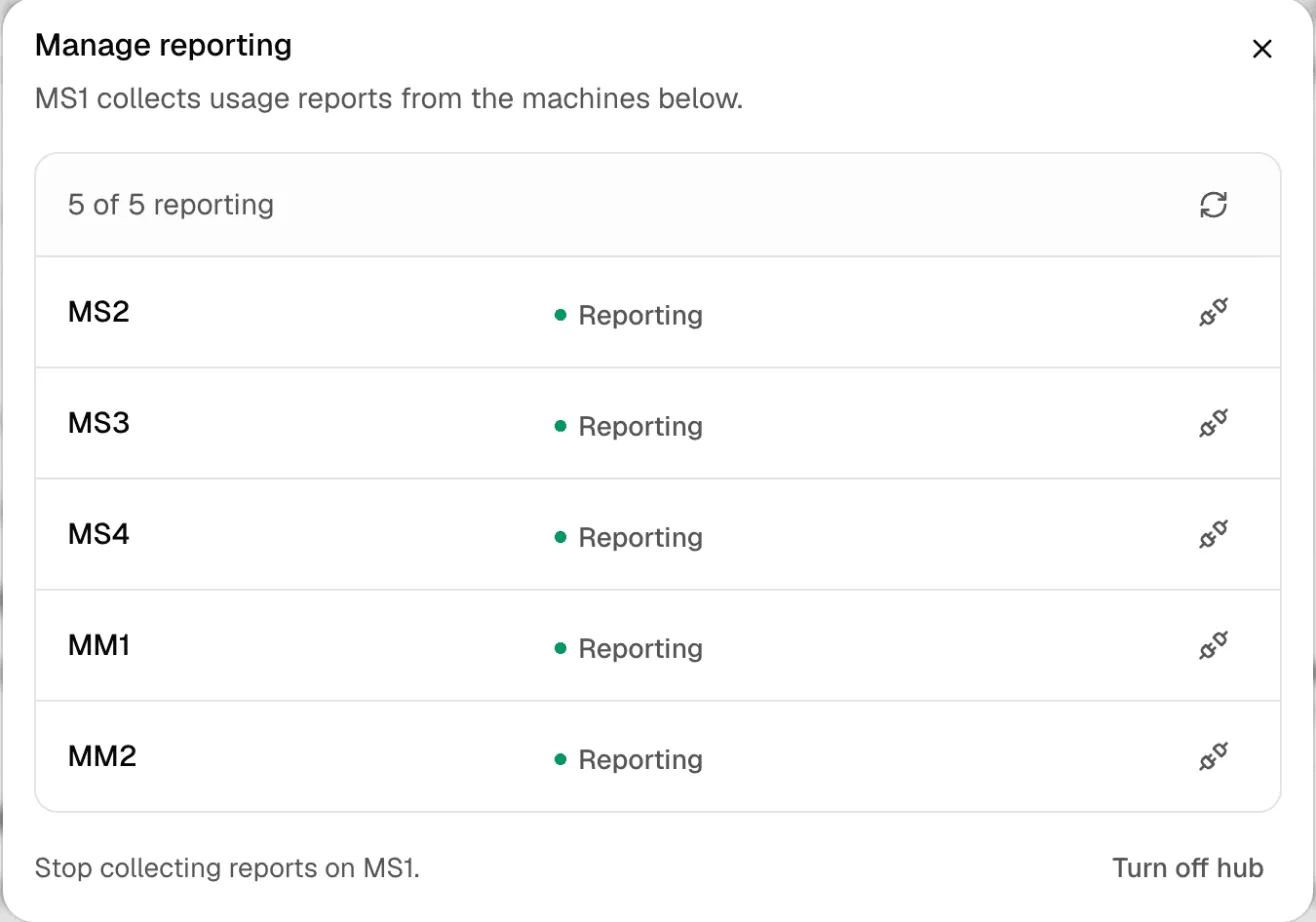
- Each machine shows Reporting, Offline, Unreachable or Couldn’t connect.
- Stop reporting takes one machine out. Report to … or Move reporting to … sends its reports to another hub. Old reports stay with the old hub.
- Turn off hub stops collecting. Machines that reported to it then need another hub.
Monitor
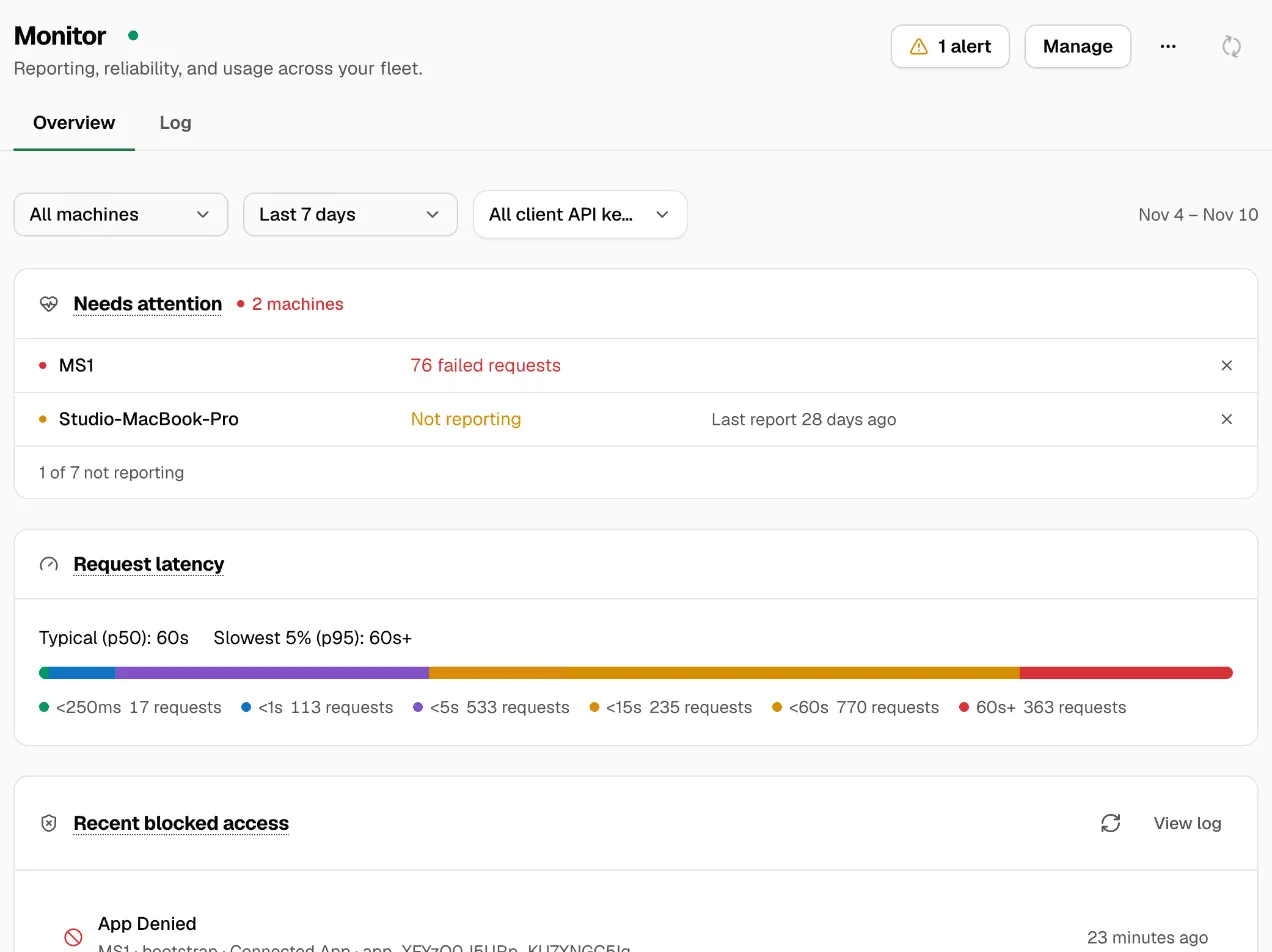
Section titled “Monitor”The Overview tab shows the fleet for the machines, period and API keys you pick at the top.
| Card | What it tells you |
|---|---|
| Needs attention | Machines with failed requests, or Not reporting, with when they last reported. Click a machine to see its failed requests. |
| Request latency | The typical time (p50) and the slowest 5% (p95), and how many requests fell in each time bucket. |
| Recent blocked access | Requests Nexus turned away: a missing or wrong Nexus key, an expired key, or a connected app that was denied. View log opens the full list. |
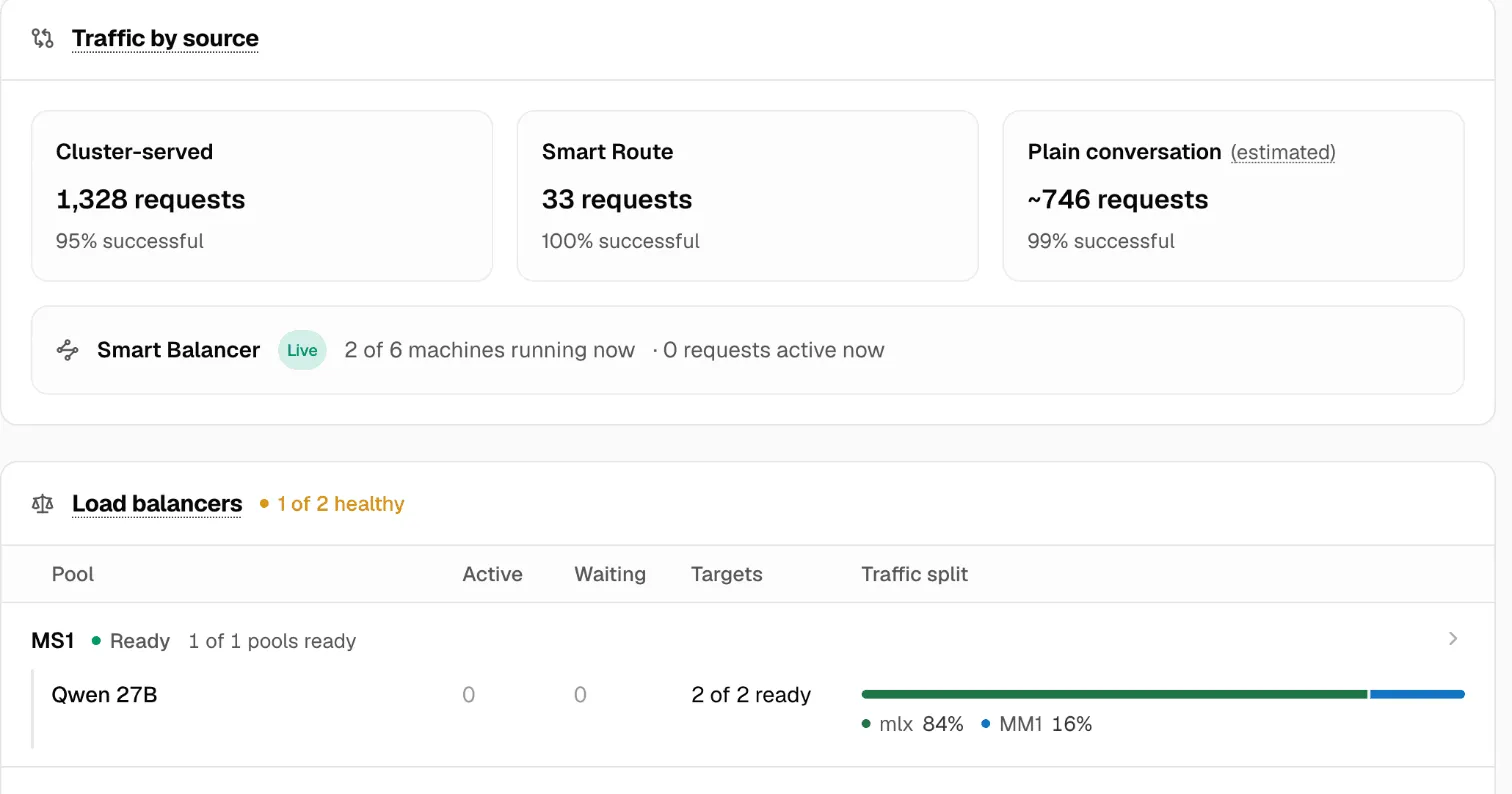
| Traffic by source | Requests served by a cluster, by Smart Routes, and plain chat, with how many succeeded. |
| Load balancers | Each Smart Balancer pool on each machine: active and waiting requests, ready targets, and how traffic is split. |
| Clusters | Each cluster model, its speed, its Macs, and how the model is split. |
| Smart Routes | Each Smart Route on each machine: active requests, decisions, fallbacks, and the last decision. |
The Log tab is the Fleet log: every blocked request, with when, the issue, the machine, who asked, and what for. Filter it by issue type (Incorrect key, Nexus Guard, Permission, Request failed, Other) or machine, or search it. Open in … audit log jumps to that machine’s own log. For changes people made to settings, see Audit.
A machine that is offline or updating can leave gaps. Open it before you change anything.
Insights
Section titled “Insights”Insights turns weeks of usage into numbers you can plan with.
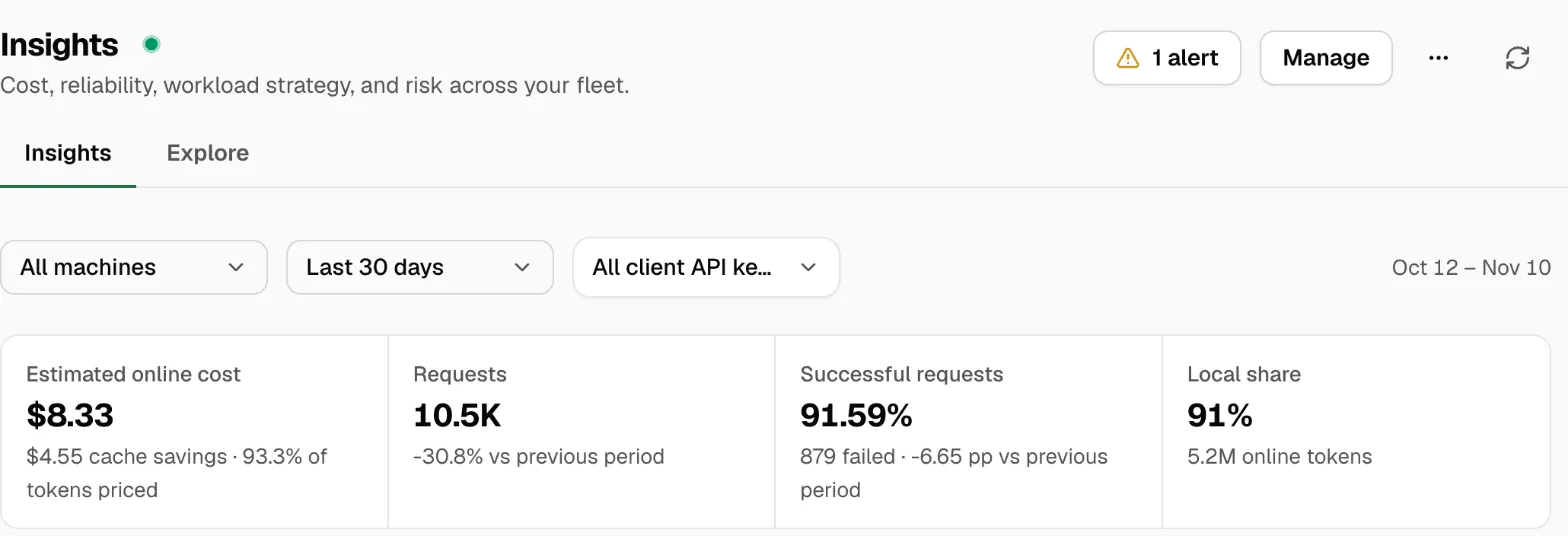
At the top: Estimated online cost (with cache savings and how many tokens have a price), Requests, Successful requests, and Local share: how much of the work stayed on your own machines.
Below that:
- Smart Routes: what a suggested Smart Route could save, compared with sending everything to your most expensive model. Create route sets it up.
- Spend this month, with Set budget.
- Local and online usage, and Provider and model popularity (All, Online only or Local only).
- Where the work goes, by cost, tokens or requests.
- Request reliability: successful and failed requests over time.
- Online usage by machine and Work across machines.
- Decision signals and Data protection: what decision presets and Data Protection did.
- Data quality and blind spots: what the numbers may be missing.
The Explore tab is the table behind it: each model with its requests, failures, success rate, tokens, share of tokens, and whether it’s local or online. Explore all data on a card opens that card’s rows here.
What a team manager sees
Section titled “What a team manager sees”A team manager sees the machines of the teams they manage, including shared machines lent to their team. They don’t see other teams’ machines, or organization settings such as billing, plan, SSO and entitlements. Usage that can’t be split by team safely is left out of their numbers. See Teams & policies.
If something goes wrong
Section titled “If something goes wrong”Check these in order:
- The hub is online.
- The machine is online and in the right organization.
- The machine reports to that hub, under Manage.
- The machine and the hub run a recent Nexus. A machine marked as needing an update can’t report everything. Update it.
- The period you picked has finished requests in it.
- Your role includes that machine or team.
| What you see | What to do |
|---|---|
| Monitor is unavailable | Retry, or check the hub’s connection. |
| Monitor is on … | Another machine is the hub. Click View on … to switch to it. |
| A machine says Not reporting | Bring it online, then check it under Manage. |