
Cluster utilization
Enterprise
The Utilization tab on the Cluster page shows how hard each Mac and each Thunderbolt cable works. It shows the last hour, one reading per second. Open Cluster on the managing Mac, then click Utilization, between Overview and Plan.
Use it to answer questions like these:
- Does the model use every Mac I gave it, and how hard?
- Is a cable the slow part, or is a cable running without RDMA?
- How close is each Mac to its memory limit?
- What happened a few minutes ago, when replies got slow?
What it measures
Section titled “What it measures”The tab shows four things for every Mac or cable. Each has its own scale.
| Section | What it measures | Scale |
|---|---|---|
| GPUs | Share of time the Mac’s GPU was active, as macOS reports it. | 0 to 100% |
| Power | GPU power in watts. | 0 to a top that fits the highest reading so far, such as 0–170 W. All Macs share it. If a Mac draws more, the top grows and older readings redraw to fit. |
| Memory | The model’s memory on the Mac, as a share of the Mac’s memory limit. A Mac outside the model reads 0. | 0 to 100% of the limit |
| Cables | Traffic on each cable, as a share of what the cable can carry. The legend says what 100% is, such as 100% is 7.5 GB/s. | Log or linear (see below) |
Two cables between the same Macs are two columns, #1 and #2, and two rows in the tables, such as MS3 ↔ MS4 · cable 2.
GPU active time is not speed
Section titled “GPU active time is not speed”GPU active counts the time the GPU had work, not how much work it did. A GPU that waits for another Mac can still count as active. So 80% doesn’t mean “80% of full speed”, and two Macs at 90% can still make tokens slowly.
How the model is split changes what’s normal:
- Split evenly: every Mac works on every token, so the Macs show similar, high numbers, such as 70 to 95%.
- Split by memory: each Mac works only on its own layers, then hands off to the next Mac. Each Mac shows lower numbers, often 25 to 45%, and that’s normal.
Why cables use a log scale
Section titled “Why cables use a log scale”Cable traffic ranges from a few KB/s to several GB/s. On a straight (linear) scale, everything below a few percent looks like 0. A model Split by memory often moves only 2 to 50 MB/s, under 1% of a Thunderbolt cable, so on a linear scale its cables look idle.
Log (the default) gives each step of ten the same height: 0.1%, 1%, 10% and 100% sit evenly apart. Small loads stay visible, and a cable near 100% is still clearly near the top. Switch Cable scale to Linear when you want height to match the share directly, for example to compare two busy cables.
Each step on the log scale is ten times the one below. At 7.5 GB/s for 100%, the marks read about:
| Mark | Traffic |
|---|---|
| 100% | 7.5 GB/s |
| 10% | 750 MB/s |
| 1% | 75 MB/s |
| 0.1% | 7.5 MB/s |
| 0.01% (the floor) | about 0.75 MB/s |
GPUs, power and memory always use a linear scale.
The window: live or looking back
Section titled “The window: live or looking back”Everything on the tab, except Timelapse, shows one stretch of time, called the window. By default it’s live: the last 5 minutes, moving with the clock. Pick another length with Window: 30 s, 1 min, 5 min, 15 min or 60 min. A short window shows what happens during one reply. A long window shows how busy the cluster was over time.
Timelapse
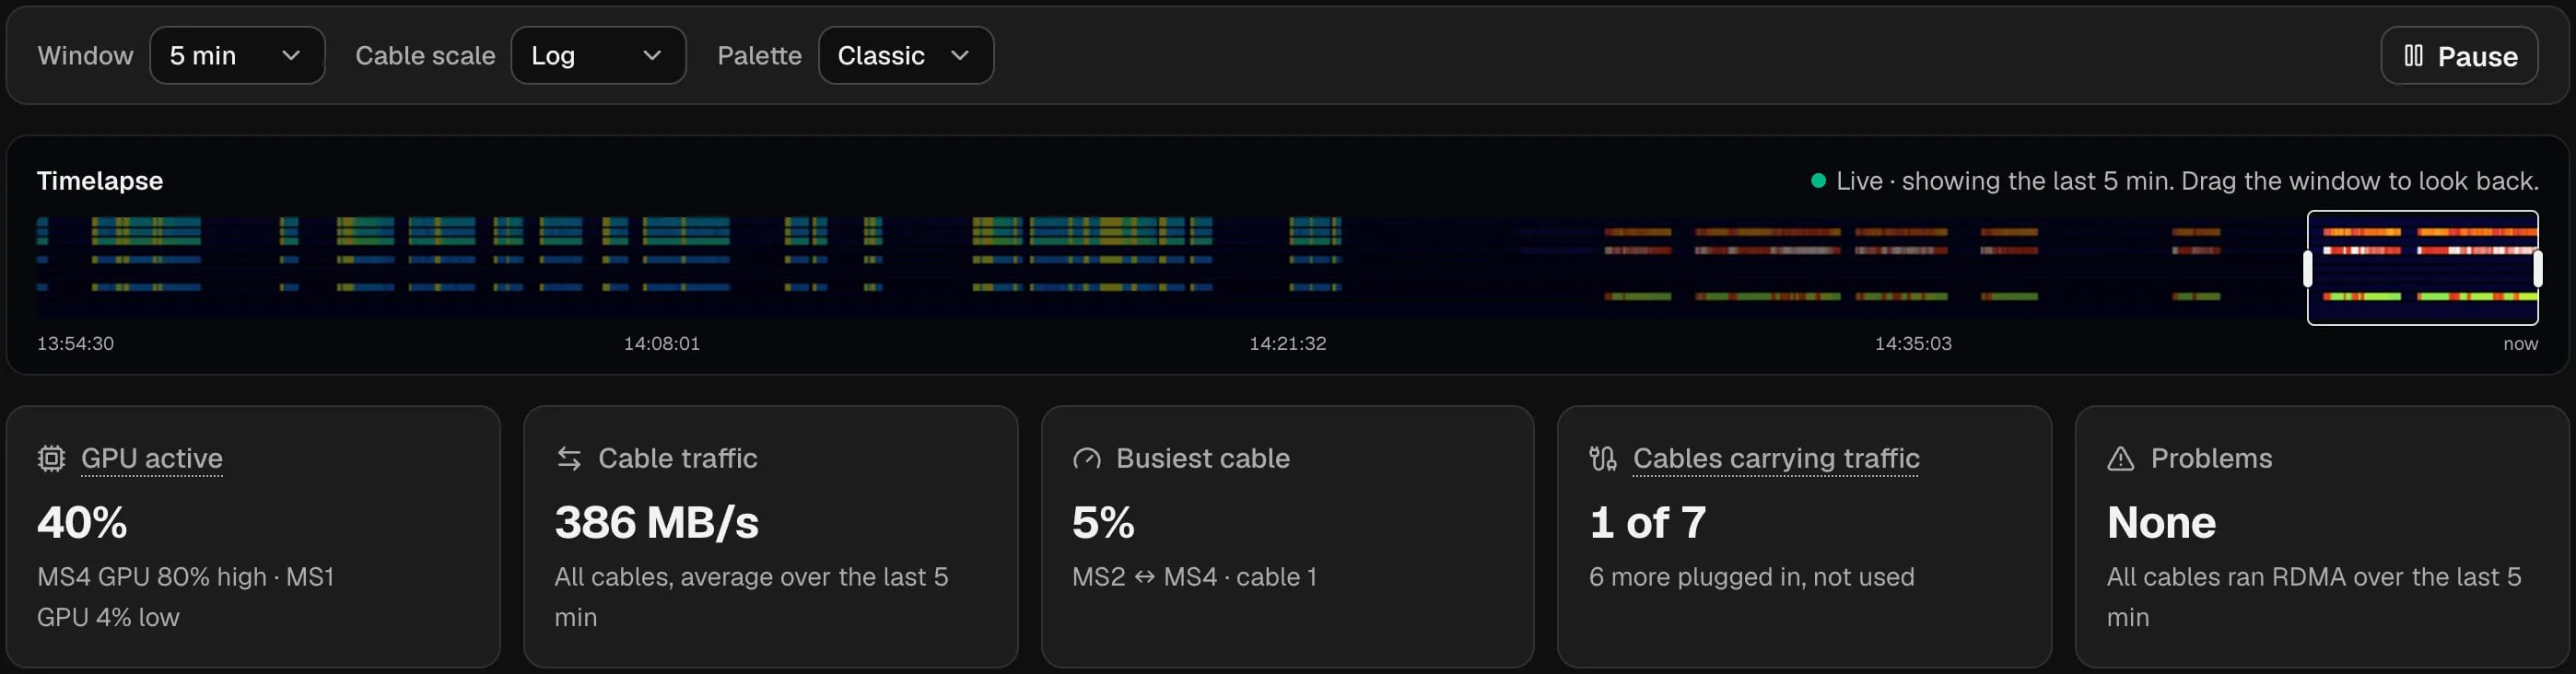
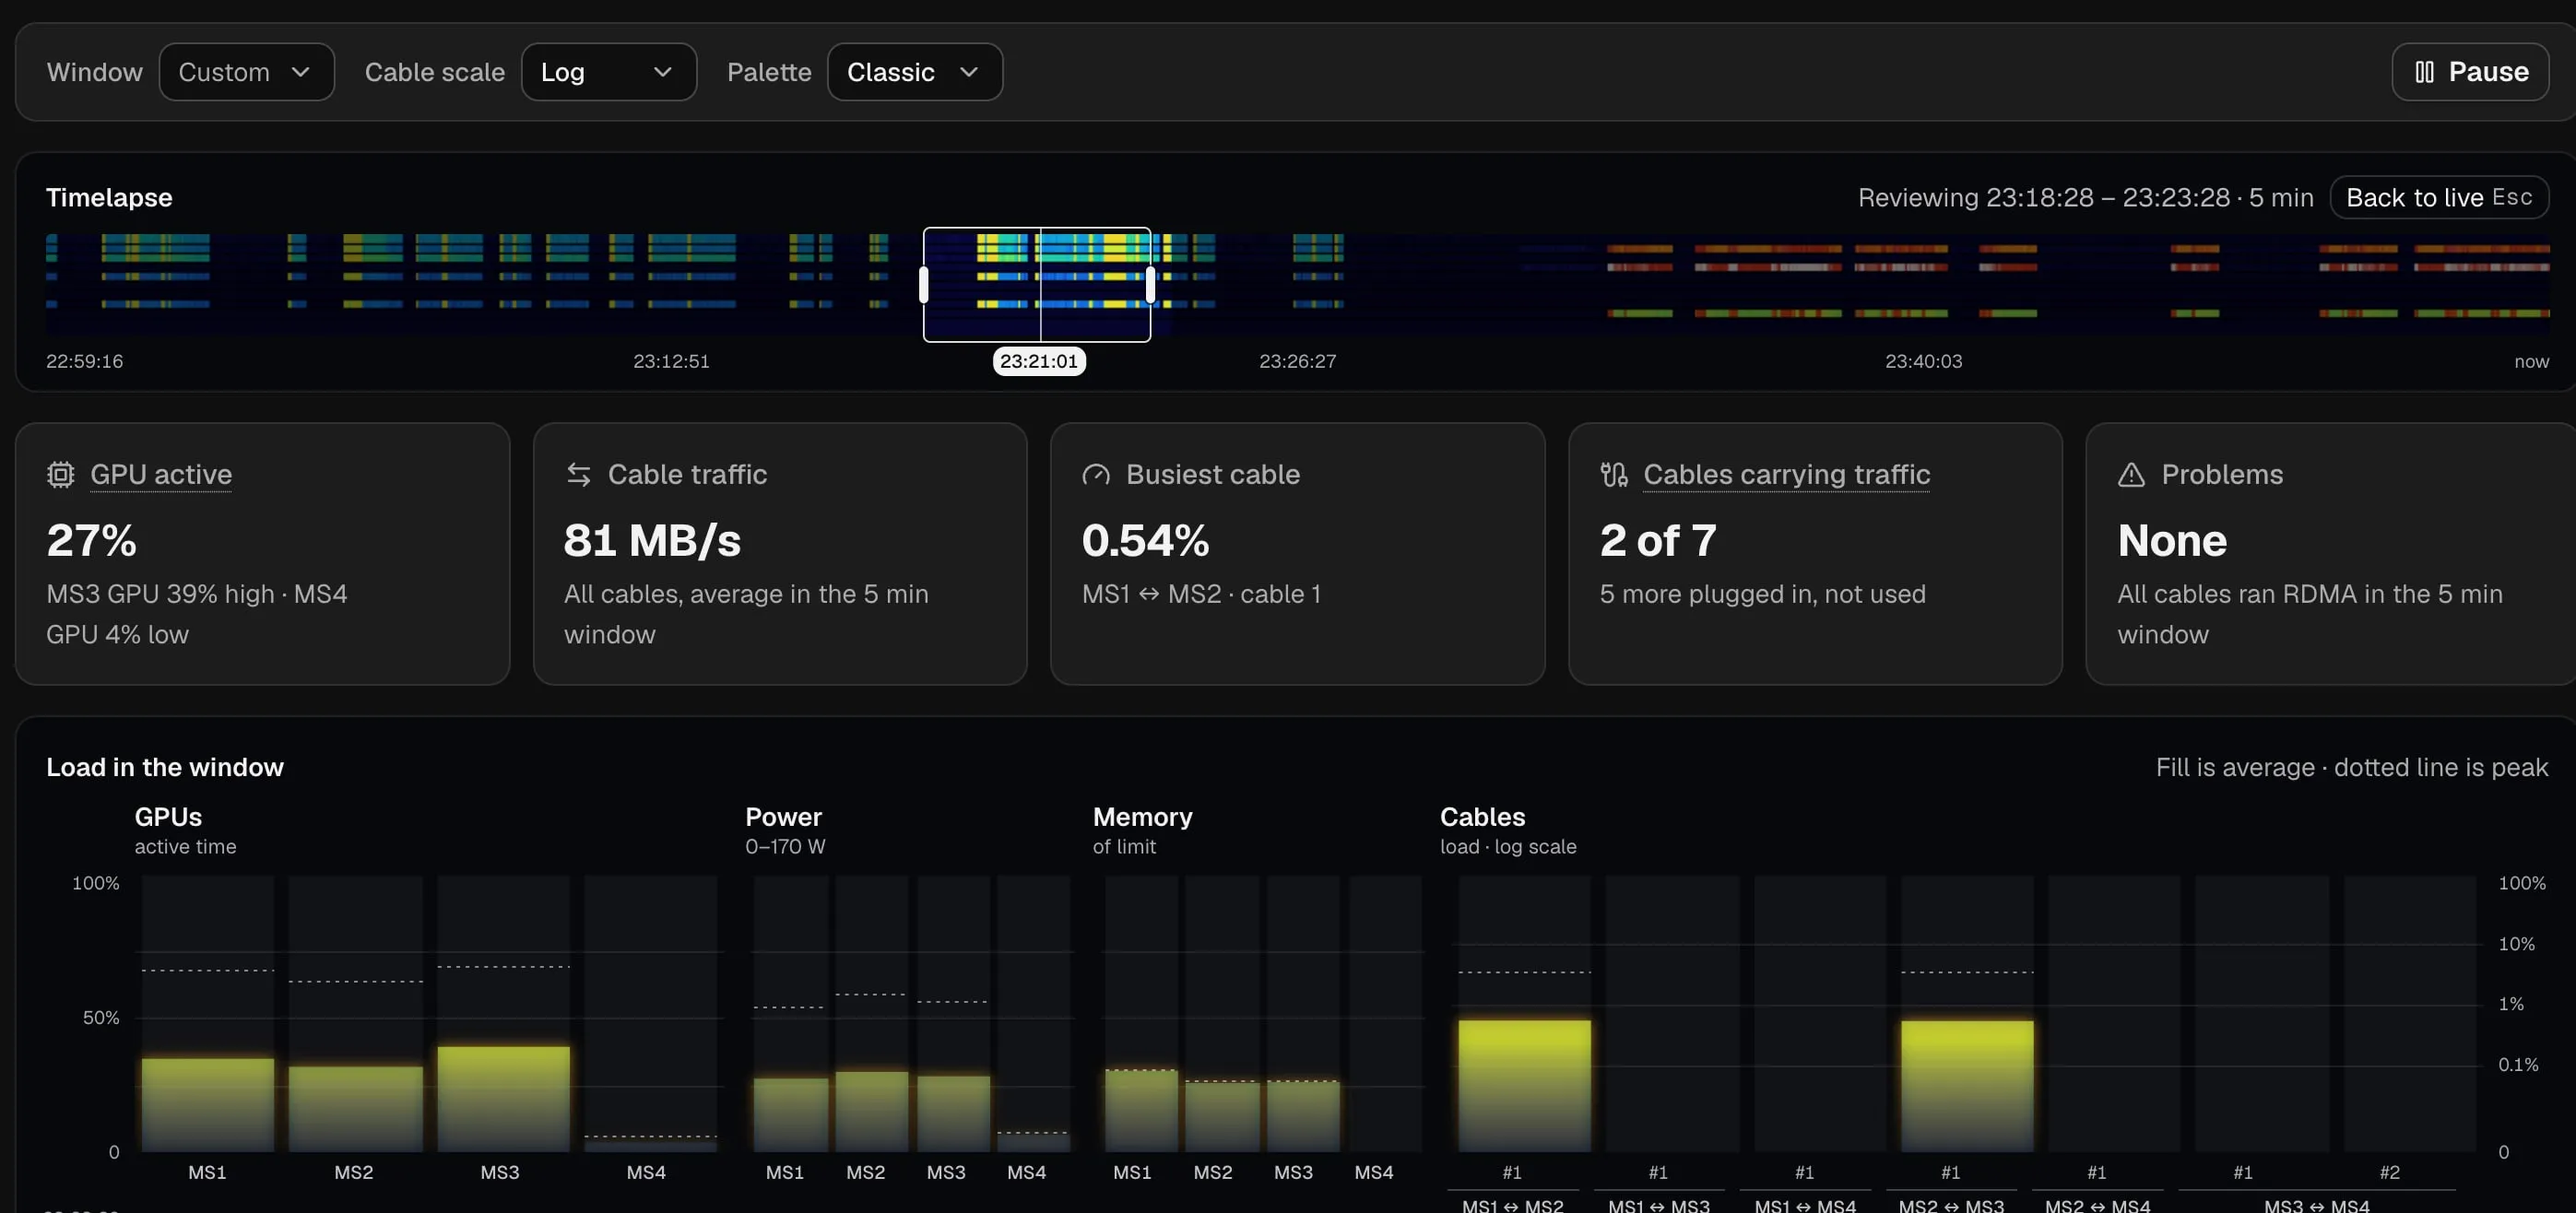
Section titled “Timelapse”Timelapse is the whole hour as one strip, oldest at the left and now at the right. Each thin row is one GPU or cable, colored by how busy it was. The box on the strip is the window. Timelapse stays at the top of the page while you scroll, so you can move the window and watch the charts below change.
To look back:
- Drag the box along the strip. Drag its edges to make it shorter or longer, down to 30 seconds.
- Click anywhere on the strip to move the box there.
- With the strip selected, press ← or → to move the box, and + or − to resize it.
While you look back, the strip says Reviewing with the times, such as Reviewing 23:18:28 – 23:23:28 · 5 min, and Window shows Custom. To go back to live, click Back to live, press Esc, or drag the box to the right edge.
Pause freezes the live view, so the charts stop moving while you read them. Resume starts it again. Nexus keeps recording while it’s paused.
The tiles
Section titled “The tiles”The five tiles sum up the window.
| Tile | What it says | Example |
|---|---|---|
| GPU active | The average active time of all GPUs, then the busiest and the quietest Mac. | 40%, MS4 GPU 80% high · MS1 GPU 4% low: two Macs run the model, two are free. |
| Cable traffic | All cables together, on average. | 386 MB/s |
| Busiest cable | The cable with the most traffic, as a share of what it can carry. | 5% on MS2 ↔ MS4 · cable 1 |
| Cables carrying traffic | How many cables carried real traffic: more than 0.01% of capacity, about 1 MB/s, at some point. Cables with only background traffic don’t count. | 1 of 7, 6 more plugged in, not used |
| Problems | ⚠ N not RDMA: a cable ran over Thunderbolt IP or the network instead of RDMA, which is much slower. N no reading: a Mac or cable sent no readings. | None, All cables ran RDMA over the last 5 min |
The charts
Section titled “The charts”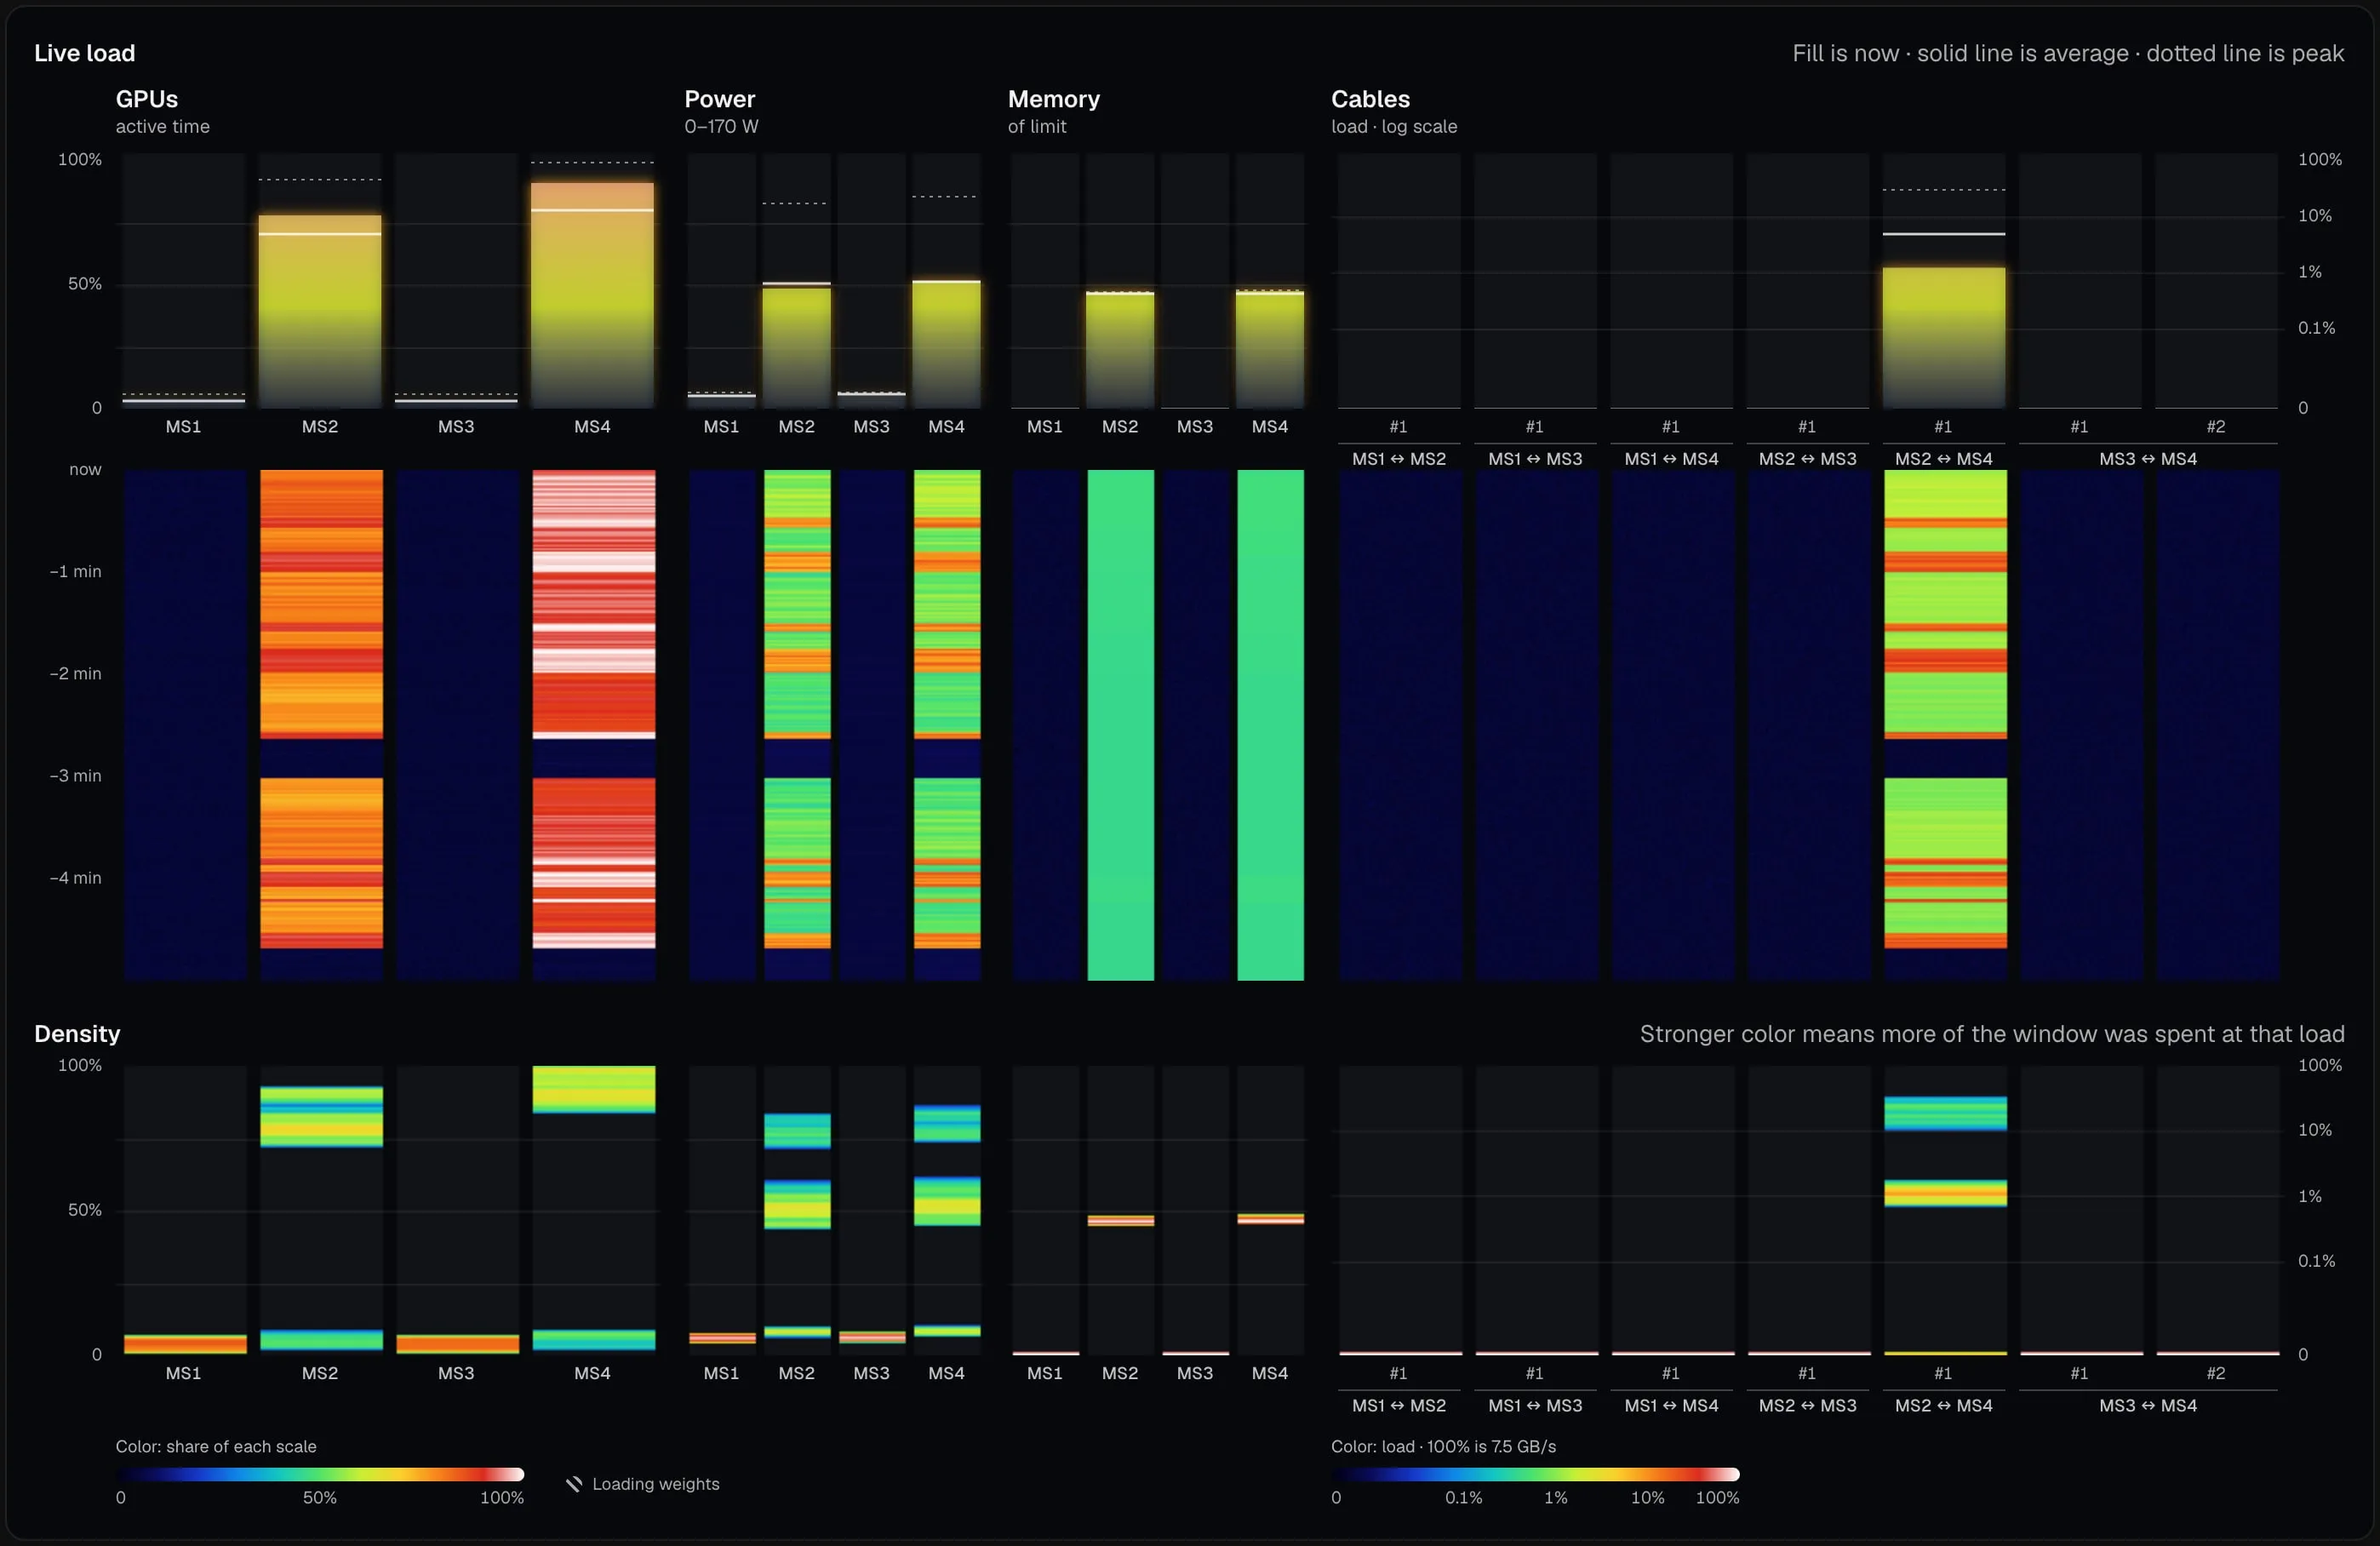
The charts sit in one panel with the same columns, left to right: GPUs, Power, Memory and Cables. Each column is one Mac or one cable, labeled at the bottom. Point at a column, in any chart, the map or the tables, and the same Mac or cable lights up everywhere. In the waterfall and Density, a label shows the Mac or cable, the time and the value, and says Loading weights when the Mac was loading a model.
Colors
Section titled “Colors”Colors show how high a value sits on its scale. With the Classic palette, dark blue is 0, then green, yellow, orange and red, up to white at 100%. Inferno and Blue use other colors for the same idea. The legends under the panel give the scale: Color: share of each scale for the Mac sections, and Color: load · 100% is 7.5 GB/s for cables.
Live load
Section titled “Live load”The bars at the top show each column now.
- The fill is the value now.
- The solid line is the average over the window.
- The dotted line is the peak in the window. A peak stays until it moves out of the window.
For example, MS2’s GPU bar is filled to 78%, with the solid line at 71% and the dotted line at 92%. That means the GPU is 78% active now, averaged 71% over the last 5 minutes, and was never above 92%.
While you look back, the chart is called Load in the window. There’s no “now” in the past, so the fill shows the average and the dotted line the peak.
A hatched column has no reading right now. It never means 0.
Waterfall
Section titled “Waterfall”Under the bars, the waterfall shows the window over time: newest at the top, labeled now, −1 min, −2 min and so on. Each line is one moment, and its color is that column’s value then.
Read it from the top down, like a history:
- A band of warm color is a stretch of work, such as a reply being written.
- A dark gap across the GPU and cable columns is a pause between requests.
- A short, very hot band on a cable, often red or white, is usually a prompt being read. Reading a long prompt can move much more data than writing the reply.
- Stripes on a Mac’s columns mean the Mac was Loading weights: its memory climbs while its GPU waits for data.
Density
Section titled “Density”Density shows how much of the window each column spent at each level. Up is the value, as in the bars. Stronger color means more time at that level.
For example, a GPU that was busy for half the window and idle for the other half shows two marks: one near the bottom for the idle time, and a band near the top, such as 80 to 95%, for the busy time. A GPU busy the whole time shows one band. A wide band means the value moved around a lot. A thin line means it held steady, as memory usually does.
The map
Section titled “The map”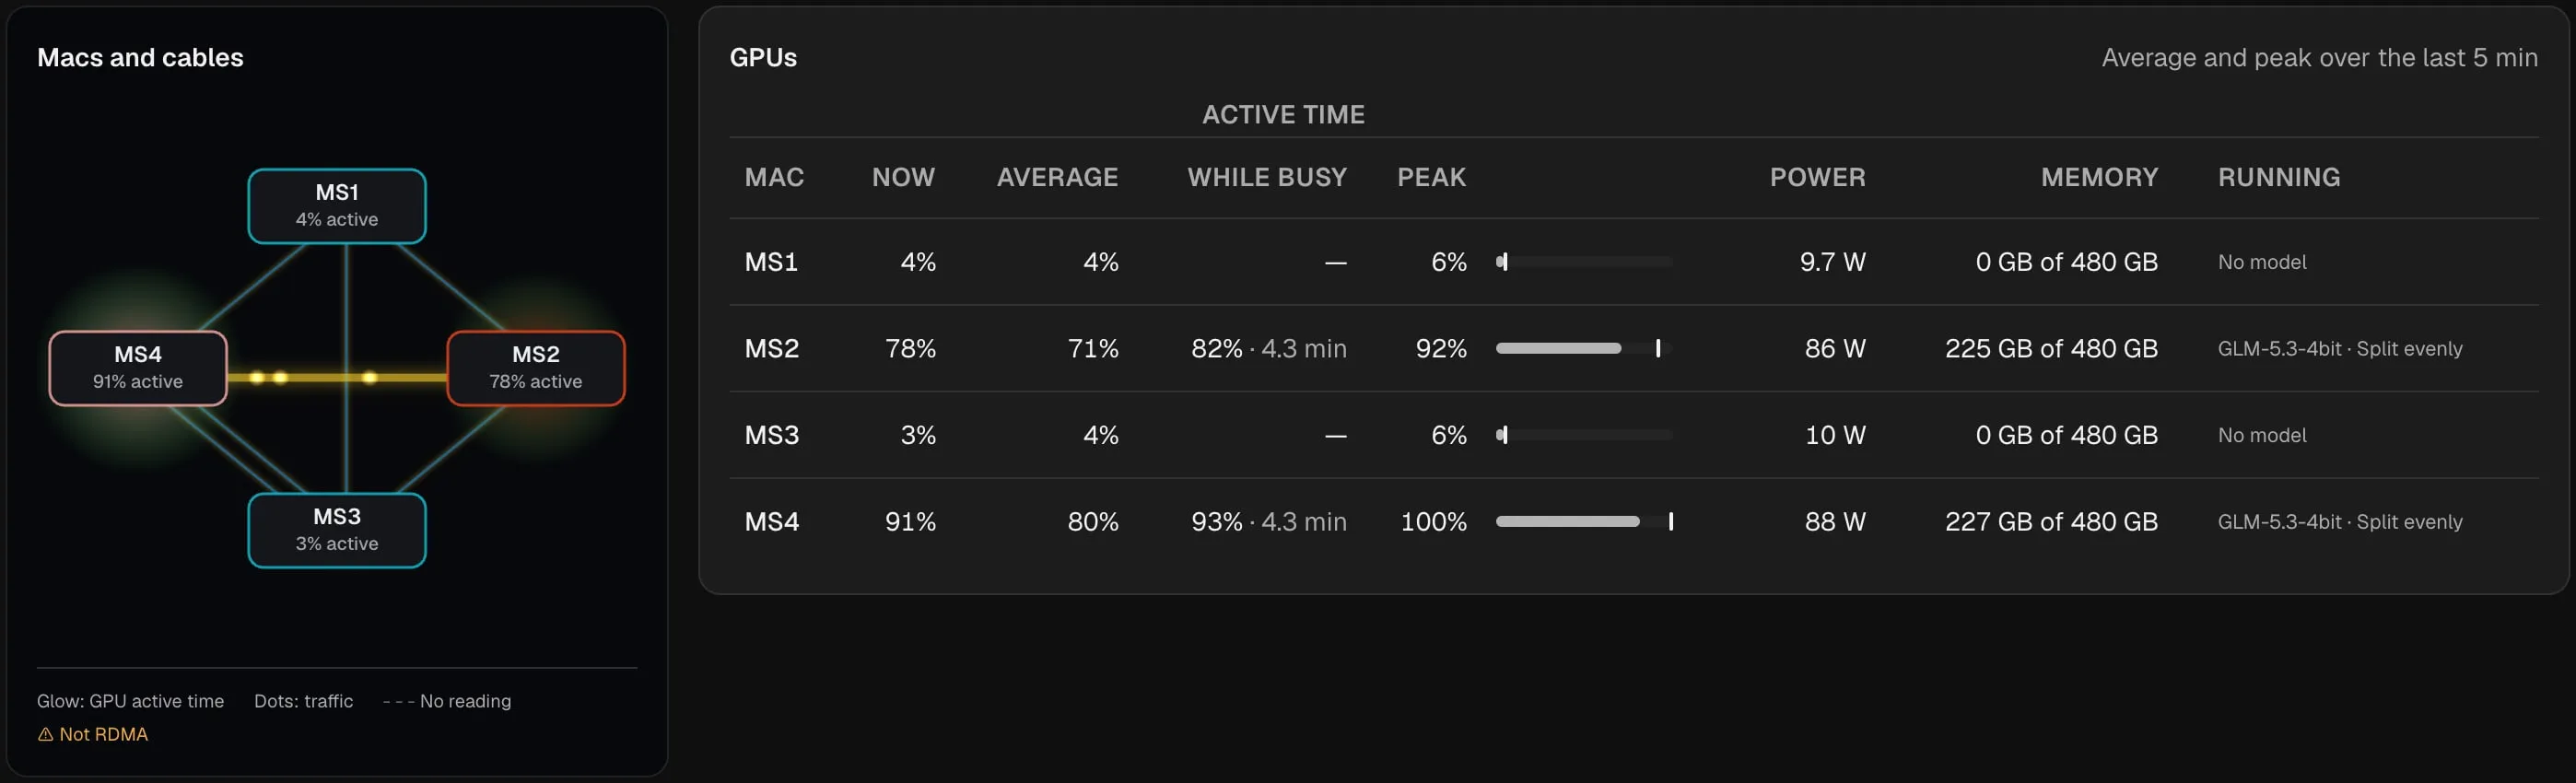
Macs and cables draws the cluster: a box for each Mac and a line for each cable. Two cables between the same Macs run side by side.
- Glow around a Mac shows its GPU active time, averaged over the window. The text under the name is the value now, such as 91% active.
- Dots moving along a cable show its traffic now. More, faster dots mean more traffic, and a busier cable draws a brighter line.
- When you look back, the glow and the dots both show the average over the window.
- A dashed line or box has No reading.
- ⚠ Not RDMA marks a cable that runs over Thunderbolt IP or the network.
The tables
Section titled “The tables”The GPUs table has one row per Mac:
| Column | What it shows |
|---|---|
| Mac | The Mac’s name. |
| Now, Average, Peak | GPU active time. The bar shows the average and the tick the peak. |
| While busy | The average of only the seconds the GPU was more than 10% active, and how long that was, such as 82% · 4.3 min. — means the GPU was never busy in the window. See Average or While busy. |
| Power | Average GPU power. Point at it to see the power now and the peak. |
| Memory | Model memory and the Mac’s limit, such as 225 GB of 480 GB: now when live, or the peak when you look back. |
| Running | What ran on the Mac in the window, with the split, such as GLM-5.3-4bit · Split evenly, or No model. A Mac that ran two models in the window shows one line for each. After a model load, it also says how long the Mac spent Loading weights. |
The Cables table has one row per cable:
| Column | What it shows |
|---|---|
| Macs | The two Macs the cable joins. A pair with two cables names its Macs once, on the first row. |
| Cable | The cable’s number between that pair. |
| Link | How the cable carries traffic: RDMA (the fast path), Thunderbolt IP or Network. |
| Now, Average, Peak | Traffic, in KB/s, MB/s or GB/s. |
| While busy | The average of only the seconds the cable carried more than 0.01% of what it can carry, about 1 MB/s, and how long that was, such as 449 MB/s · 4.3 min. — means the cable only carried background traffic. |
| Load | The bar shows the average and the tick the peak, on the Cable scale you picked. |
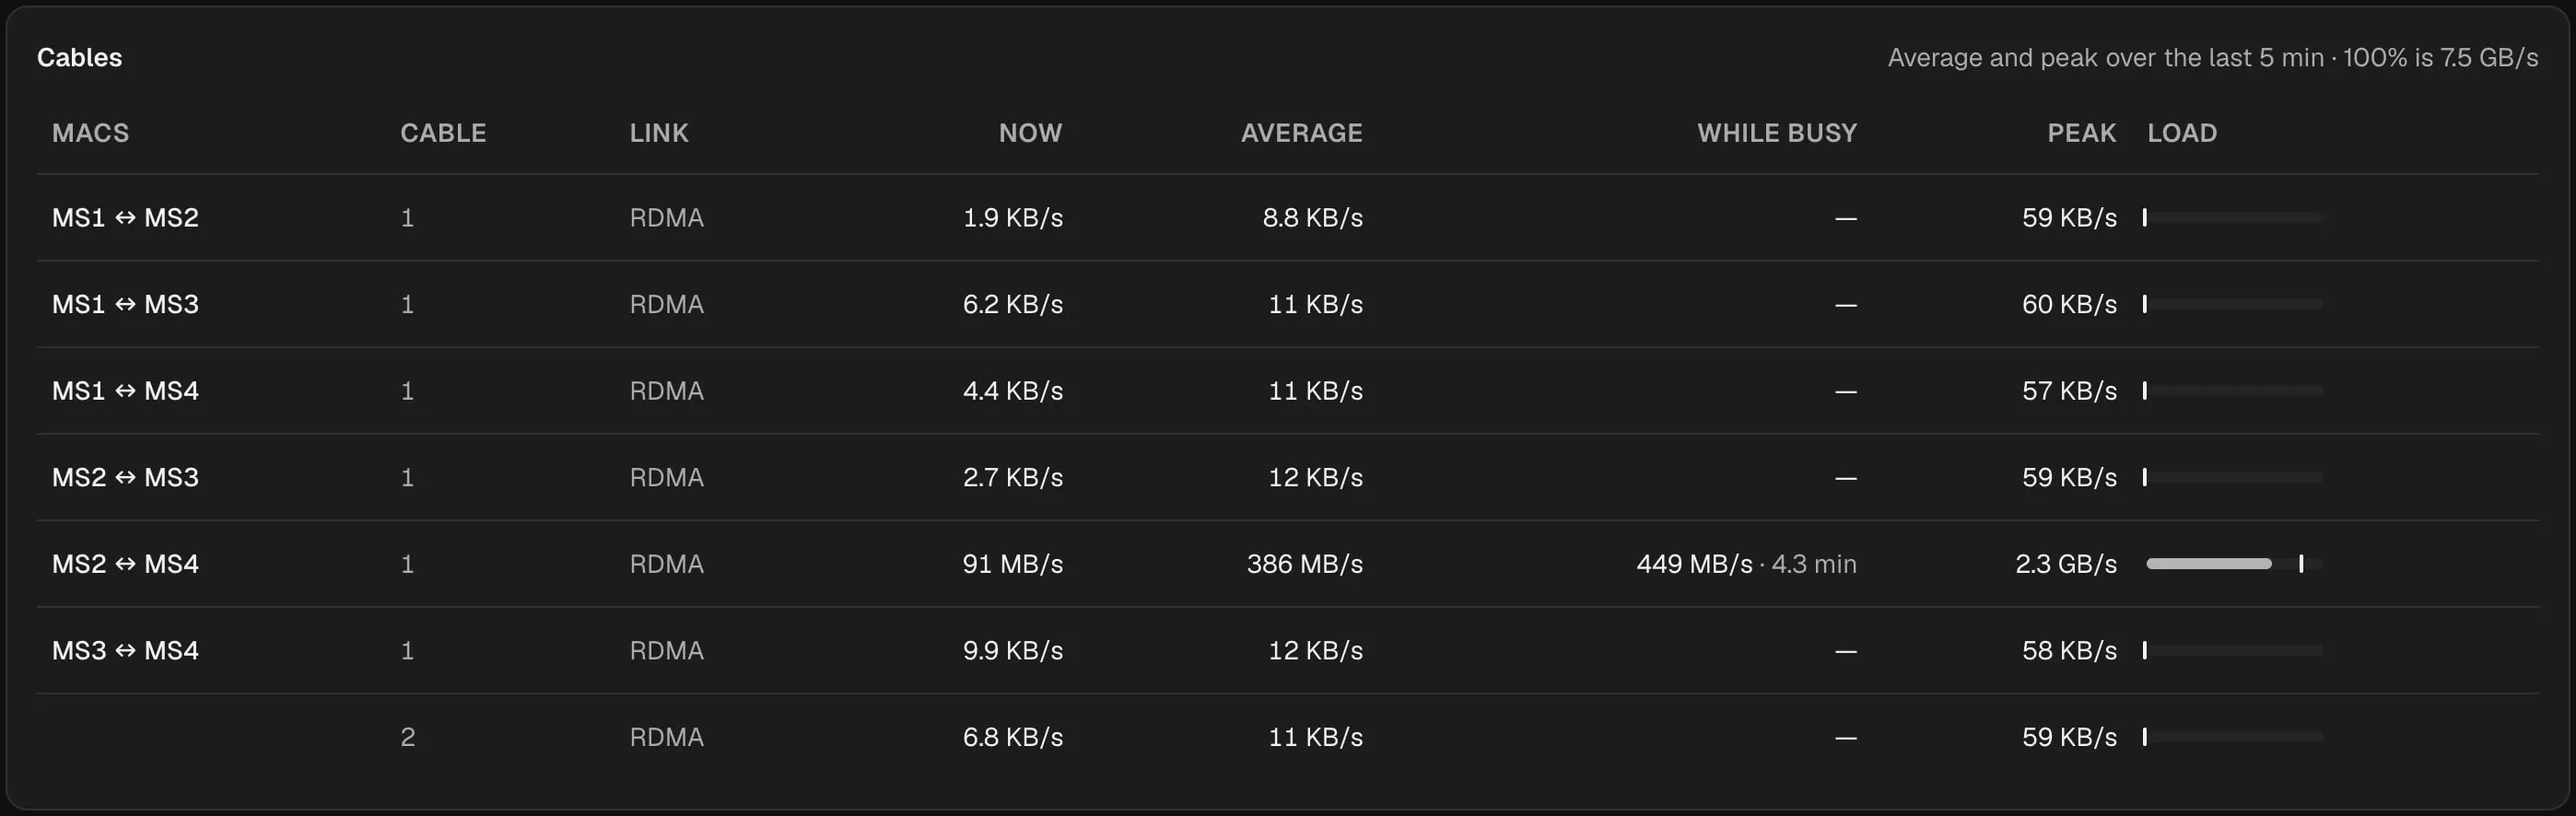
When you look back, the Now columns go away. A No reading column appears only when something sent no readings in the window.
Average or While busy
Section titled “Average or While busy”Average counts every second in the window, including the quiet seconds between requests. While busy leaves the quiet seconds out, so it shows how hard the Mac or cable works when it has work to do. Point at a While busy value to see the busy time and the window, such as Busy 4.3 min of 5 min.
For example, in a 15-minute window, a Mac answers one request that takes 3 minutes at 90% GPU. Its Average is about 20%, which looks like an idle Mac. Its While busy is 90% · 3 min: the Mac works hard, but only when asked.
- Average and While busy are close: the Mac or cable was busy almost the whole window.
- While busy is much higher than Average: the work comes in bursts. To judge one burst, look at While busy, or pick a shorter window.
- While busy is low too: the Mac or cable doesn’t work hard even with requests running. In a model Split by memory, that’s normal.
Patterns and what they mean
Section titled “Patterns and what they mean”| You see | What it means | What to do |
|---|---|---|
| GPUs of the Macs in a model Split evenly look alike, and one or more cables between them carry tens to hundreds of MB/s | A healthy split. | Nothing. |
| A model Split by memory: each Mac at 25 to 45%, cables at a few MB/s | Normal. Each Mac waits for the one before it. | Nothing. If you need more speed and every Mac has room, try Split evenly. |
| A Mac in the model stays near 0 while the others work | That Mac isn’t doing its part. | Click Check cluster on the Cluster page. |
| A cable’s peak sits near 100% during a slowdown | The cable is the limit. | Click Check cluster to test the cable. A second cable only helps when every pair of Macs has two. See below. |
| ⚠ 1 not RDMA | A cable runs over Thunderbolt IP or the network. Much slower. | Click Check cluster to find out why, such as RDMA turned off on a Mac. |
| Memory near 100% of the limit | The Mac has little room left for longer conversations. | Load with a shorter Context or fewer Conversations at once, or use more Macs. |
| Stripes and Loading weights, memory climbing, GPU low | A model is loading. | Wait. Big models can take several minutes. |
| No reading | A Mac or cable didn’t report. | Check the Mac is awake and reachable. |
| A second cable between two Macs stays idle | Normal. See below. | Nothing. |
Why a second cable can stay idle
Section titled “Why a second cable can stay idle”The cluster uses the same number of cables for every pair of Macs: as many as the pair with the fewest cables. For example, MS3 and MS4 have two cables, and every other pair has one. The cluster uses one cable per pair, so MS3 ↔ MS4 · cable 2 stays idle, and Cables carrying traffic counts it as plugged in, not used. That’s not a fault. To use second cables, give every pair two.
Settings and history
Section titled “Settings and history”- Palette: Inferno, Classic or Blue. The tab follows the Console’s light or dark theme.
- This browser remembers Window, Cable scale and Palette for your next visit. A window you dragged on Timelapse isn’t saved.
- Nexus keeps the last hour, in memory, on the managing Mac. When the Runtime on that Mac restarts, the history starts again.
- Nothing is recorded while no model runs on the cluster. Until a model runs, the tab says No cable activity yet.
- If the managing Mac runs an older Nexus, the tab says Update Nexus to see cable activity. Update it, and the tab fills from then on.